For Ag Lenders
Collateral Valuations in Seconds.
Portfolio Monitoring 24/7.
Continuous collateral valuations. Real-time LTV monitoring. Examiner-ready reports on demand. One platform replaces your entire valuation stack — at a fraction of the cost.
The Problem
Your loan officers spend hours on equipment valuations. Per-seat valuation tools cost $15,000–$75,000 a year. Land appraisals cost $500–$2,000 each and take weeks. And none of these tools give you continuous portfolio monitoring or real-time LTV tracking.
The Solution
Equipment API
Make, model, year, hours — market value with real comparables in under a second.
Land API
Lat/lon — soil productivity, farmland class, county values, yield benchmarks instantly.
Budget Tool
Farmer inputs — bank-ready season budget with breakeven analysis.
New: Loan Origination
Use AgShared for loan origination — not just maintenance.
FDIC Interagency Appraisal Guidelines allow evaluations (instead of formal appraisals) for equipment loans under $250,000. That's most ag equipment loans outside high-HP row-crop tractors and combines.
AgShared valuations meet evaluation requirements: real comparable sales from observable market inputs, documented methodology (FASB ASC 820 Level 2), timestamped audit trail, and reproducible outputs.
Origination vs. Maintenance
Traditional Origination
$500–$1,500 appraisal
2–3 week turnaround. Certified appraiser required.
AgShared Evaluation (under $250K)
Included in your plan
Instant. Market-data-backed. Examiner-ready. Same day funding.
Formal appraisals still needed for
Loans over $250K, real estate transactions over $500K, or when examiner specifically requires USPAP appraisal.
Run Valuation — Collateral Mode
Instant LTV. Collateral Adequacy. On Every Asset.
Enter the equipment details and outstanding loan balance. Get an instant collateral valuation with LTV ratio, adequacy determination, and equity cushion — backed by hundreds of thousands of real comparable sales.
Collateral Valuation Report
2021 Case IH Magnum 340
2,450 hours · Powershift · MFWD · RTK · Deluxe Cab
Collateral (Sold)
$232,000
38 auction comps
Market Ask (List)
$267,000
46 dealer listings
LTV (vs Sold)
77.2%
$179K balance
Adequacy
ADEQUATE
$53K equity cushion
ASC 820 Level 2: Sold Value from 38 completed auction transactions. List Value from 46 current dealer listings. LTV calculated against conservative sold value.
Loan Origination Evaluation
Leave loan balance blank to see max lending capacity at 80% and 100% LTV. Equipment under $250K qualifies for FDIC evaluation-based origination — no formal appraisal needed.
Collateral Monitoring
Enter outstanding balance, get LTV ratio instantly. Color-coded: green (safe), amber (approaching), red (insufficient). Automatic ADEQUATE / INSUFFICIENT determination.
Evaluation Report for Loan File
Generate a print-ready Collateral Evaluation Report with FDIC compliance language, comparable evidence, methodology, and signature lines. File it and move on.
FASB ASC 820 Level 2 Compliance
Every valuation includes methodology statement citing observable market inputs. Examiner-ready.
Comprehensive Comparable Sales
Real auction results and dealer listings scored 0-100. Filter by sold prices only. View every comp.
Email Alerts
Set LTV warning and critical thresholds per portfolio. Get email alerts when collateral values drop below your comfort zone.
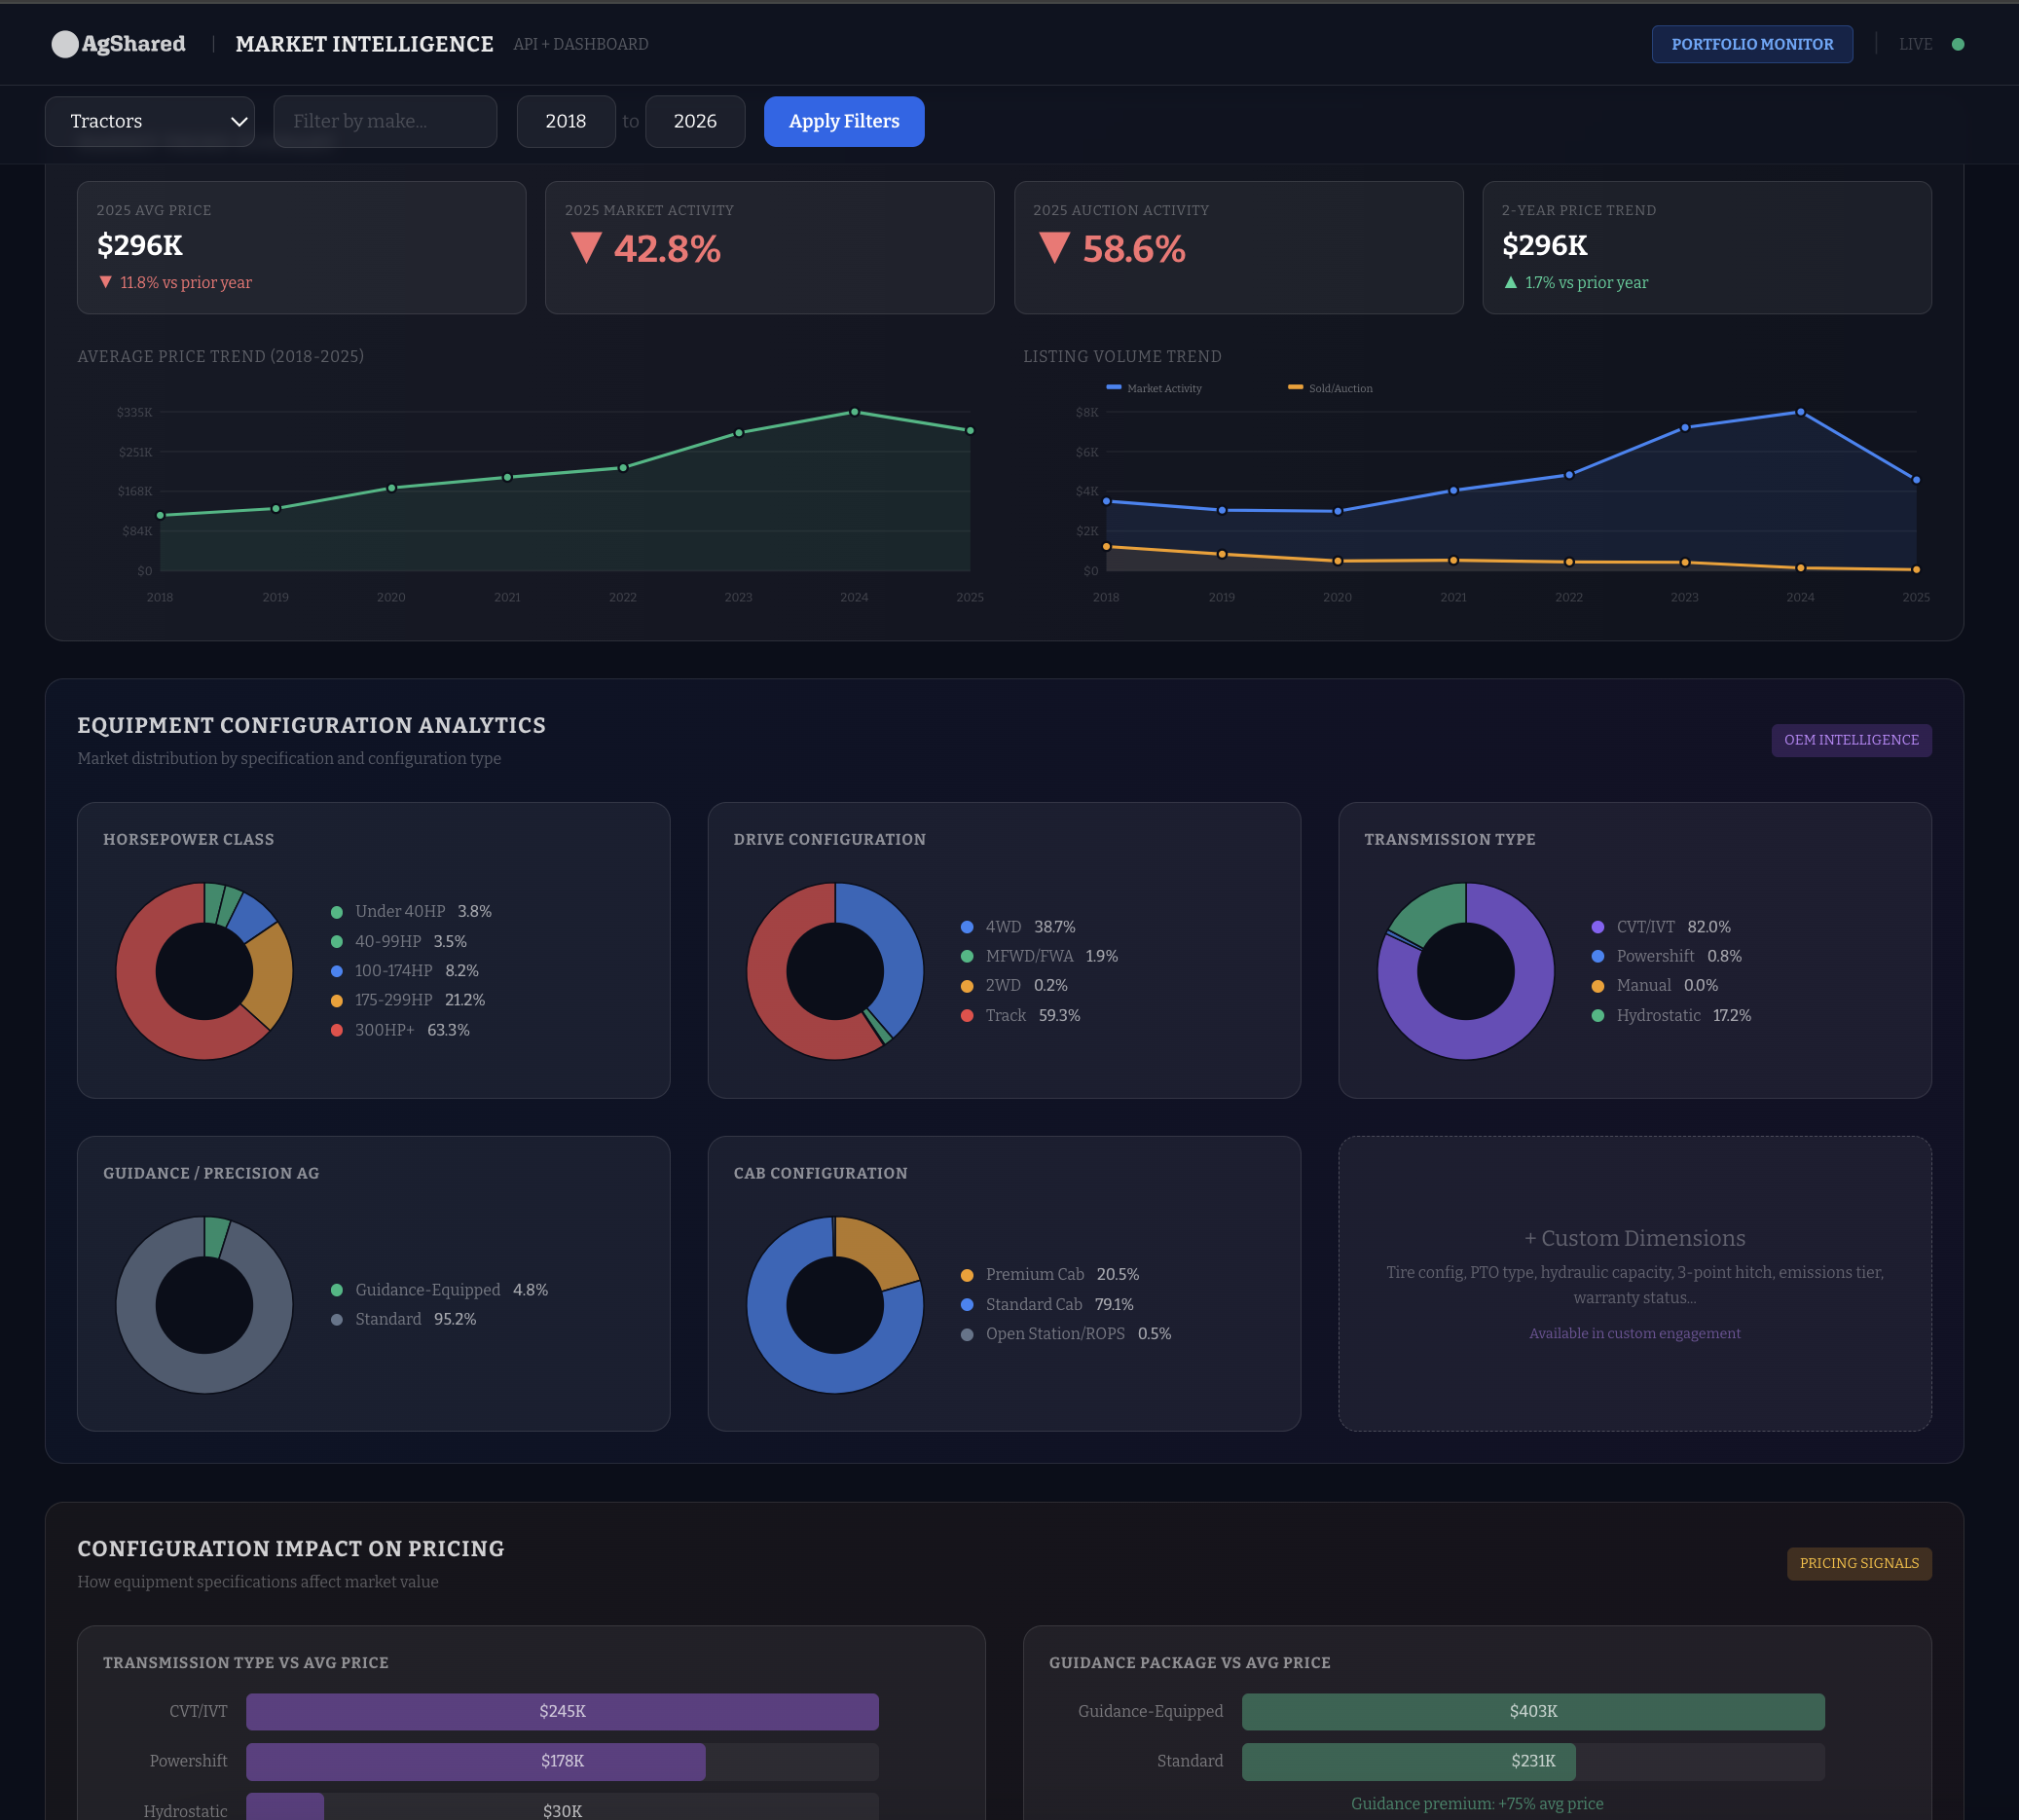
What Terminal Does For Your Loan Book
Always-on portfolio intelligence. Every asset valued, every ratio tracked, every threshold monitored — automatically.
FDIC/OCC collateral adequacy. FASB ASC 310 impairment analysis. FCA compliance. All built in.
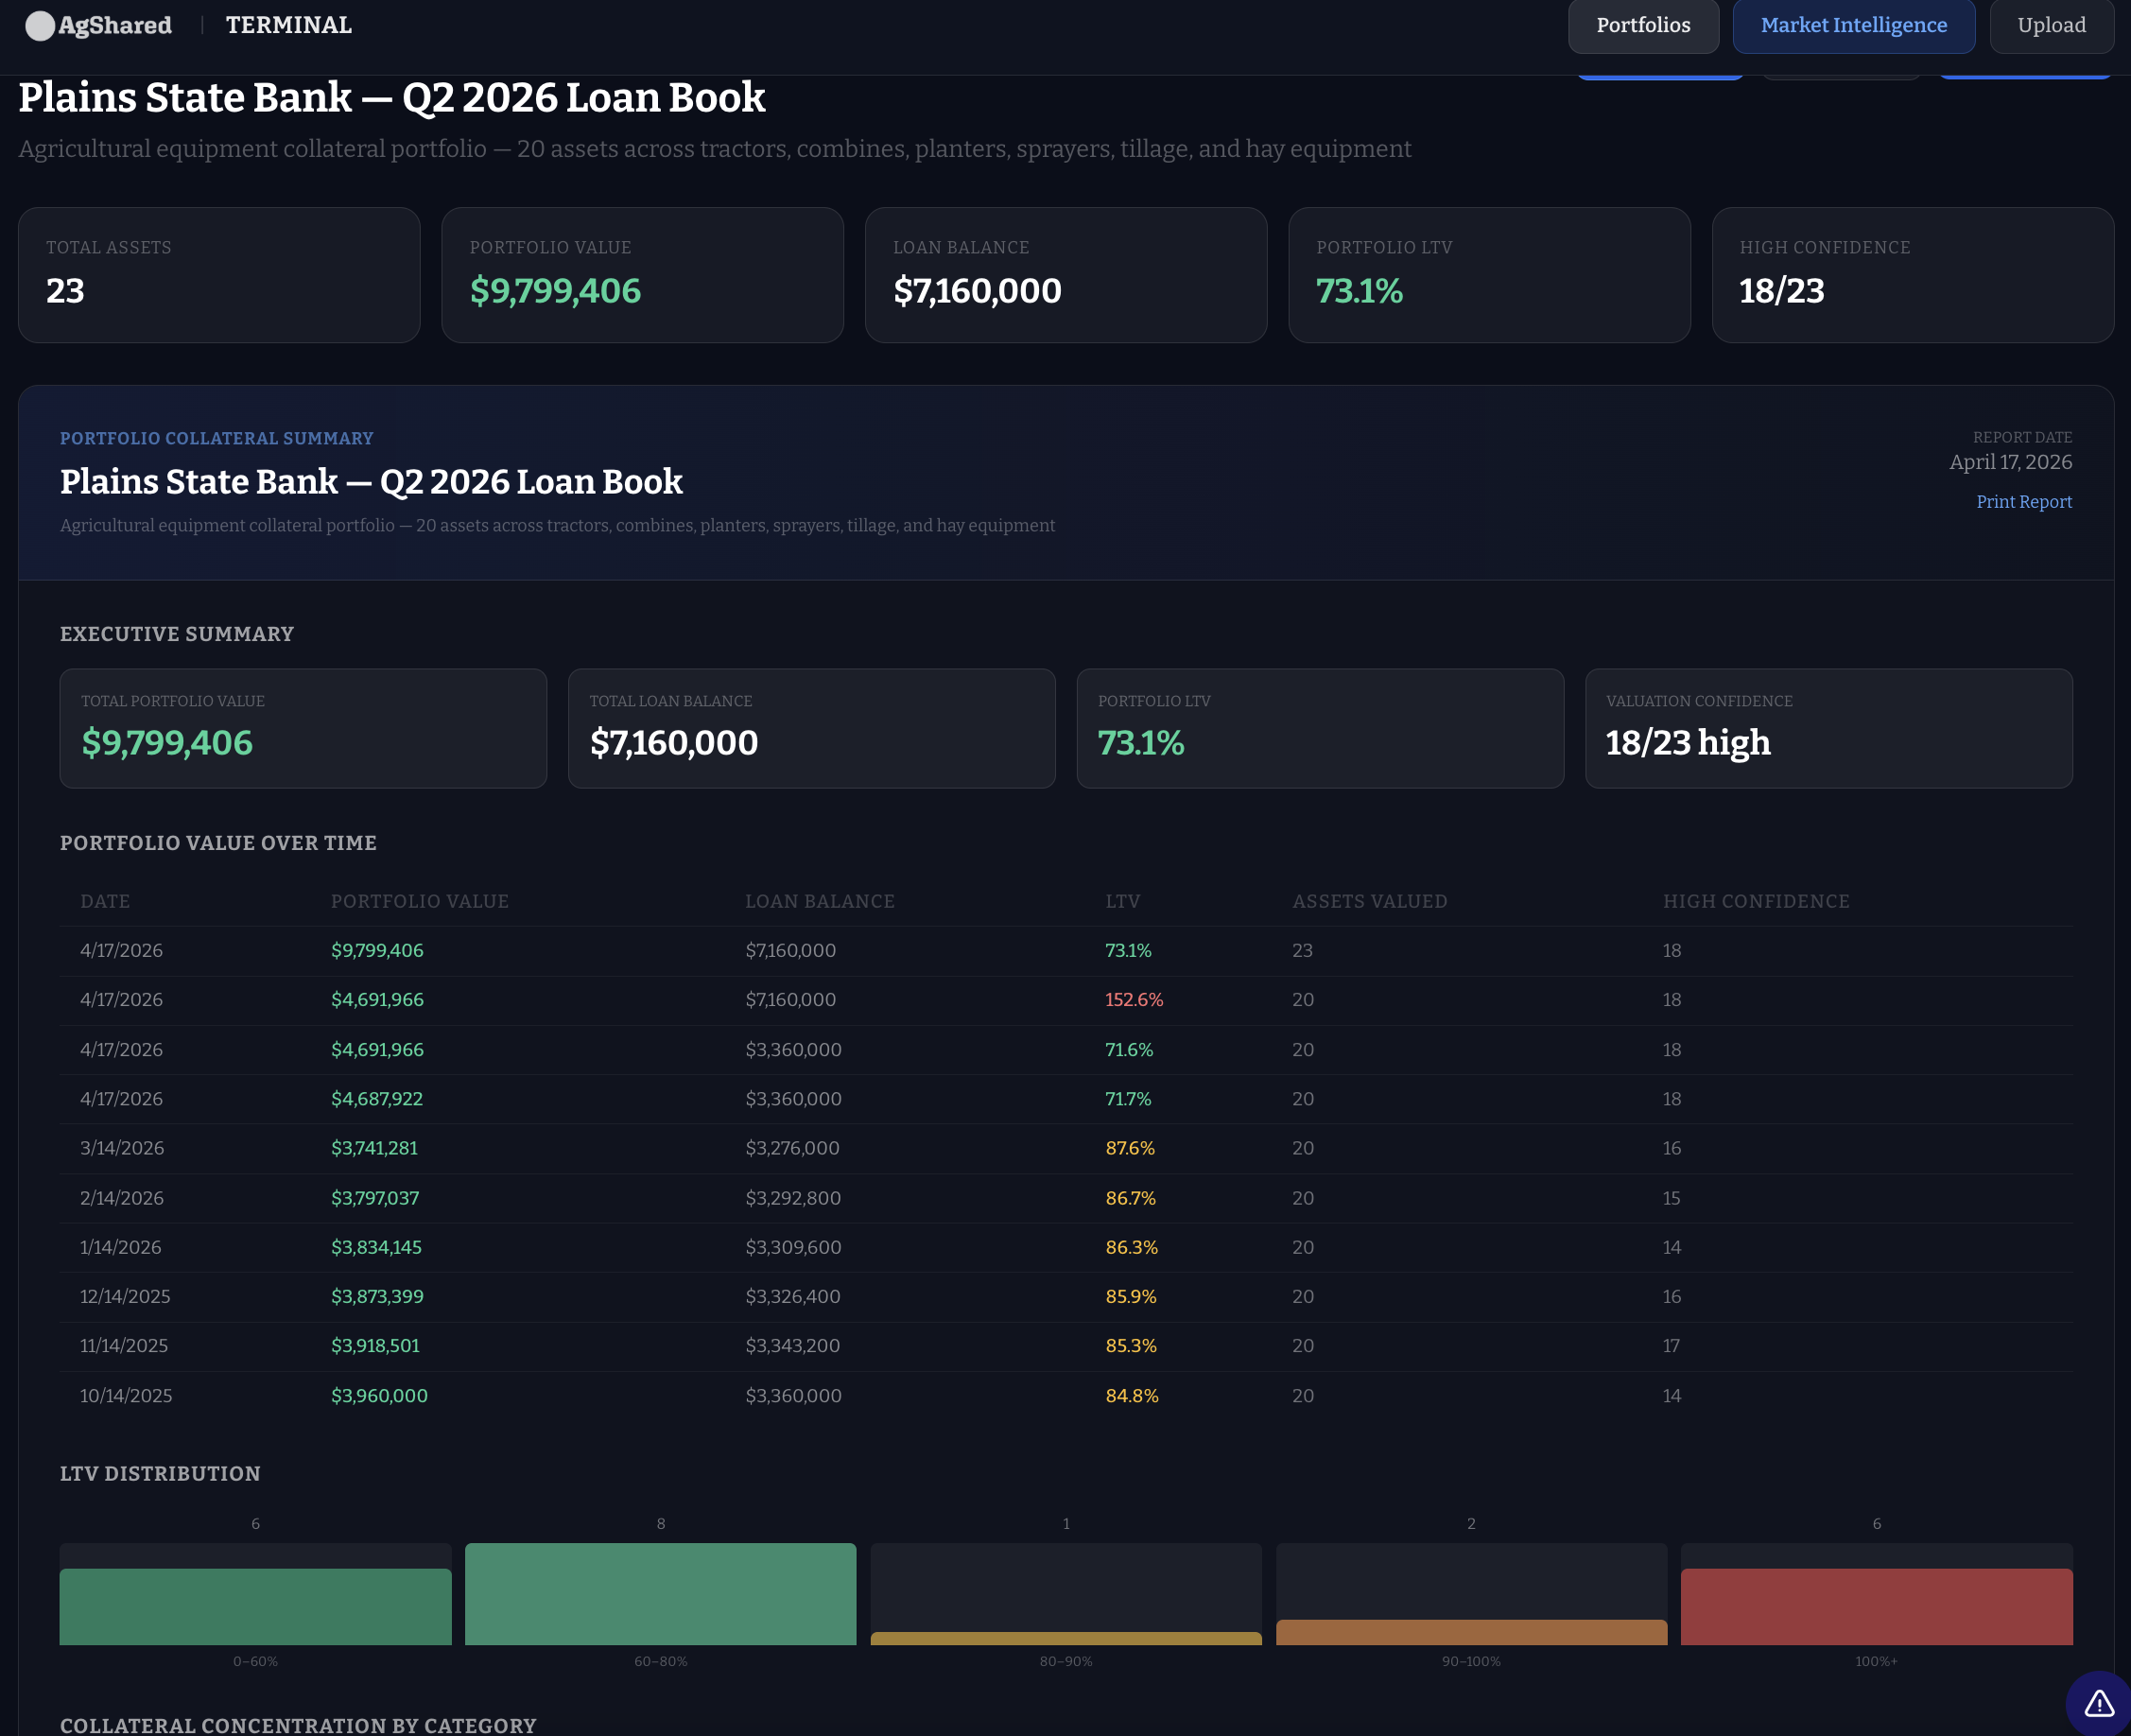
Continuous LTV monitoring
Every asset revalued weekly. LTV ratios update automatically. No manual checks.
Threshold alerts
Get notified the moment an asset’s LTV exceeds your thresholds. Critical, warning, and info severity levels.
What-if stress testing
Drag a slider to model a 20% market decline. See exactly which loans go underwater and by how much.
Multi-asset portfolios
Equipment, farmland, and crop insurance in one portfolio. Combined LTV tracking across all collateral types.
Report archive
Every valuation is timestamped and archived. Pull any point-in-time report for examiners.
PDF + CSV export
One-click portfolio summary PDFs. Asset-level collateral reports. CSV bulk export for internal systems.
What You Get
Built for Regulatory Compliance
FDIC/OCC collateral adequacy, FASB ASC 310 impairment analysis, FCA compliance — automated and audit-ready.
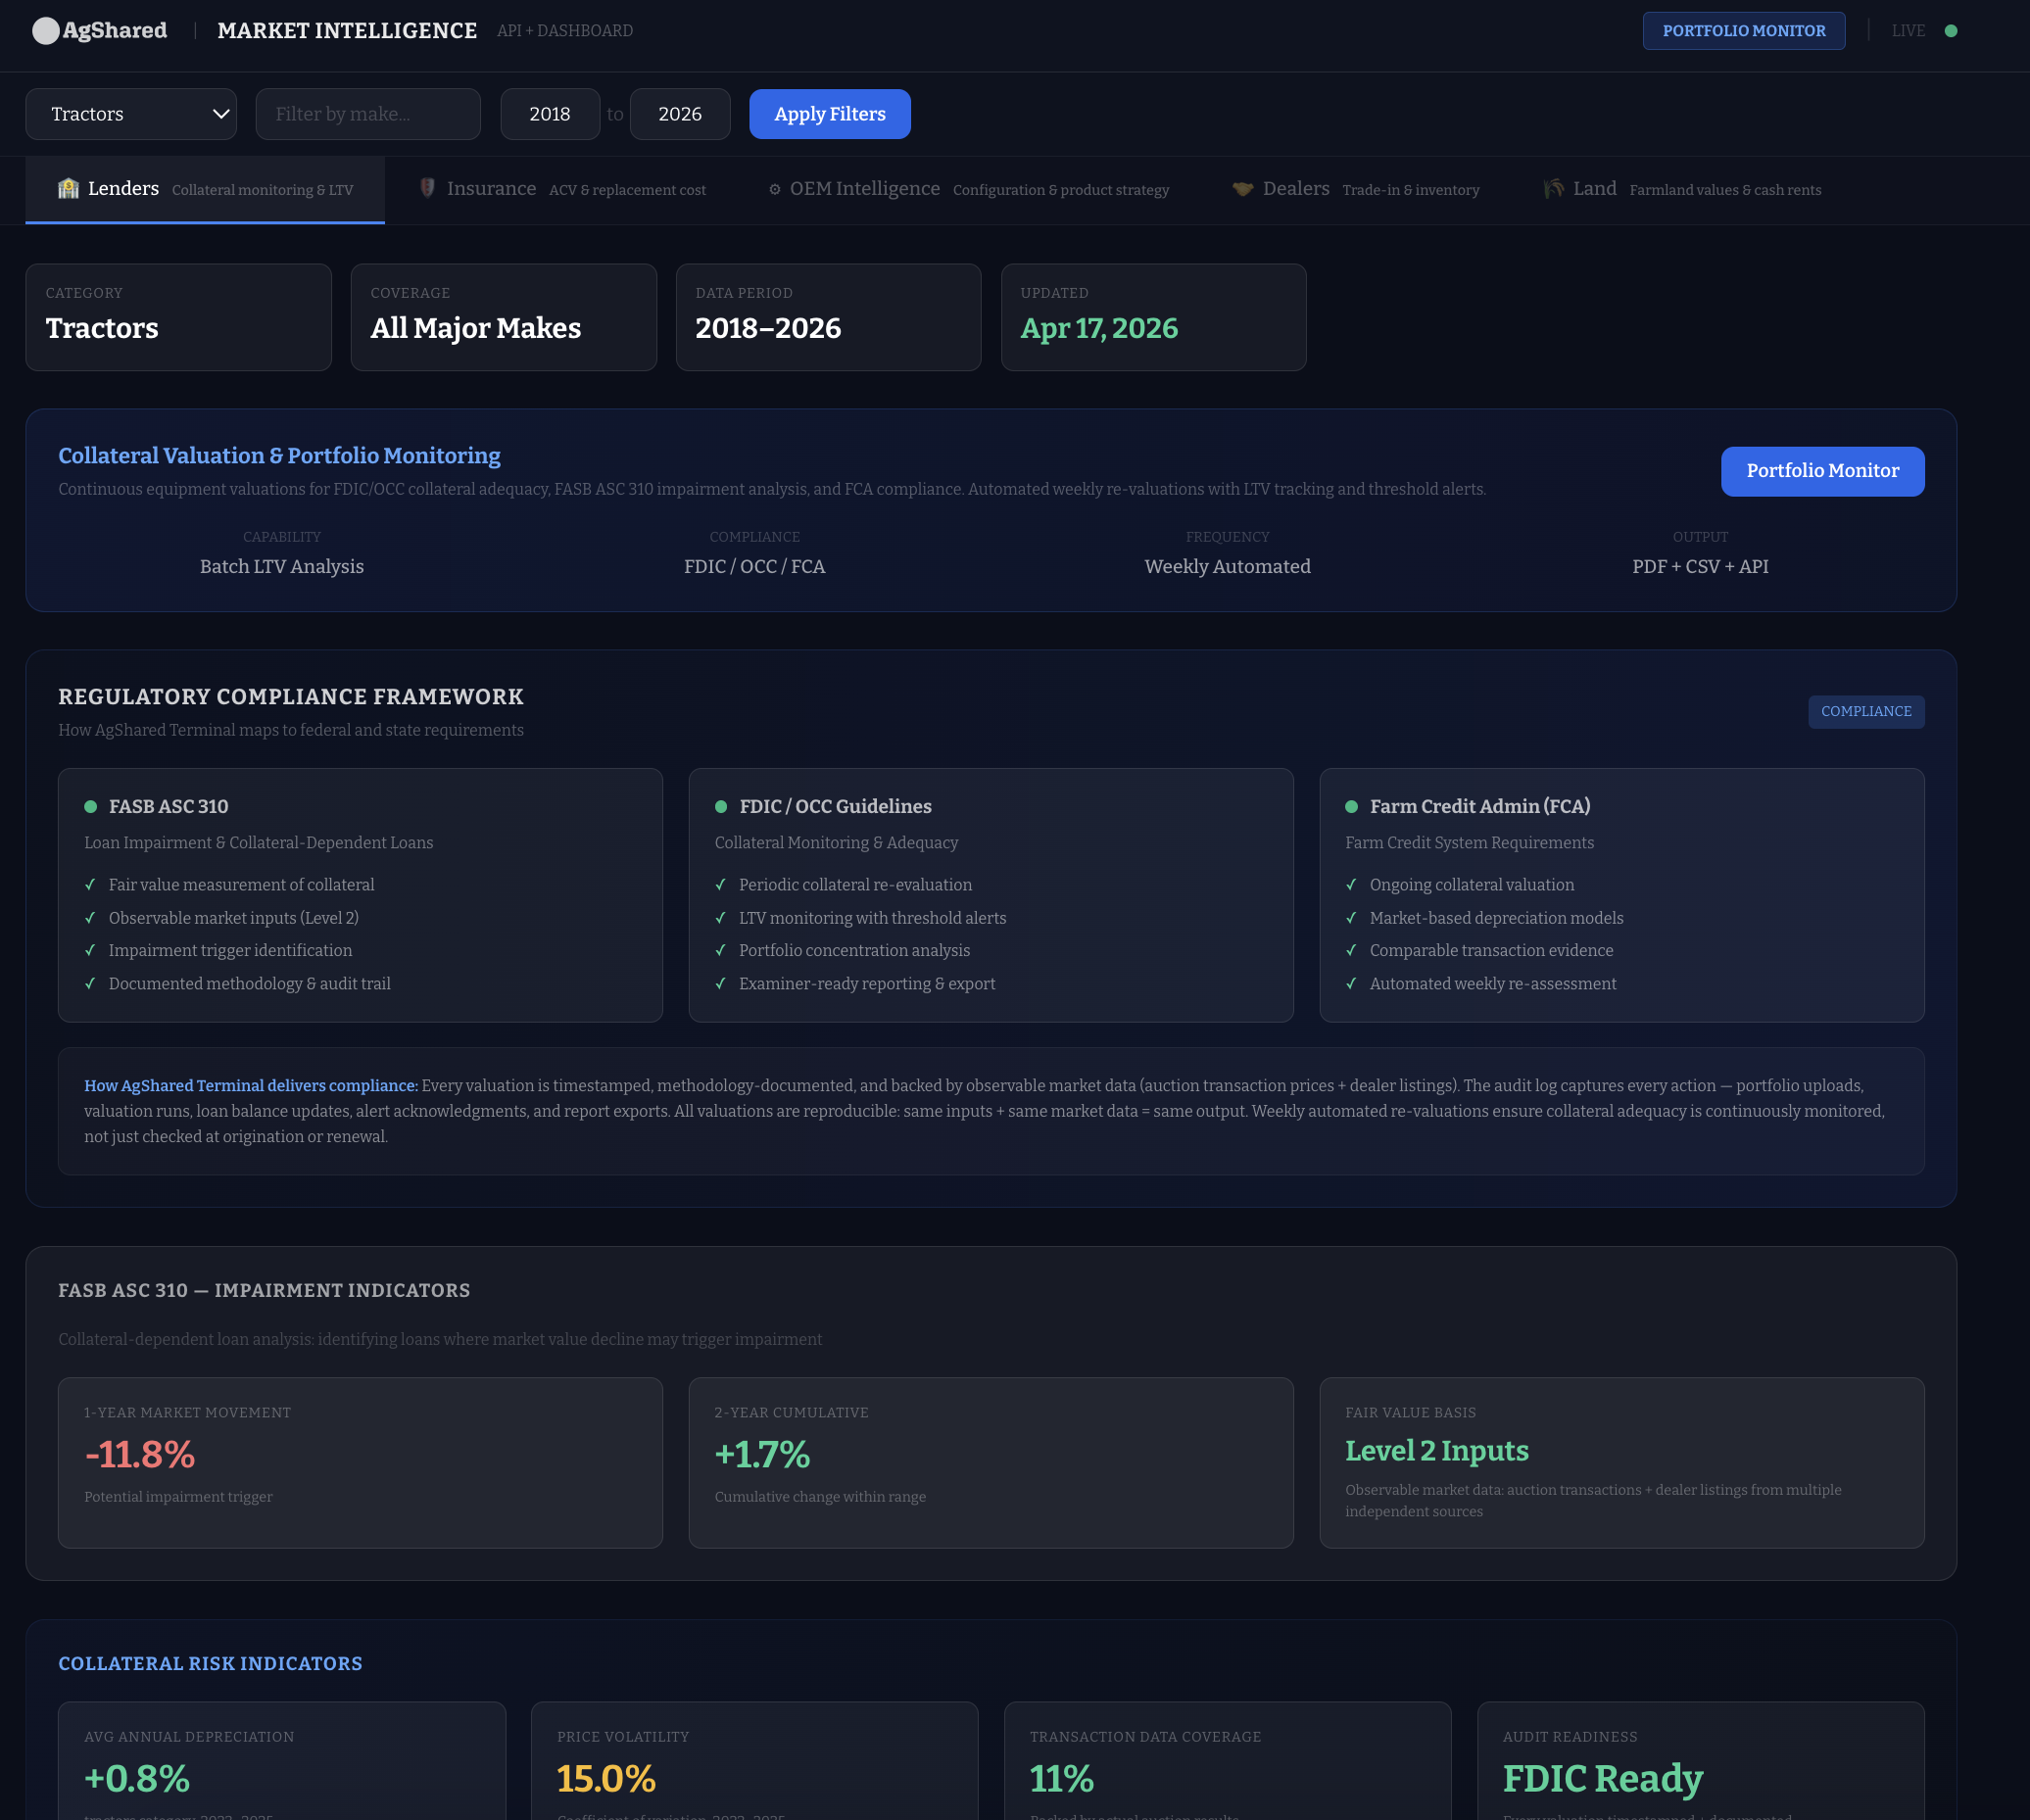
Continuous valuations backed by real market transactions. Updated weekly.
Pricing Comparison
See how AgShared stacks up against your current spend.
| Line Item | Traditional Cost |
|---|---|
| Per-seat valuation tools (50 seats) | $125/mo/seat = $75,000/year |
| Land appraisals (20/year) | $500–$2,000 each = $10,000–$40,000/year |
| Total traditional spend | $85,000–$115,000/year |
AgShared Plans
Starter
25 valuations/mo
$149/mo
$1,788/yr
Professional
100 valuations/mo
$549/mo
$6,588/yr
Business
500 valuations/mo
$2,499/mo
$29,988/yr
Enterprise
Unlimited valuations/mo
$8,999/mo
$107,988/yr
All plans include Terminal portfolio monitoring, LTV tracking, compliance reporting, and AI assistant. No per-seat fees.
Pick Your Volume
Every plan includes Terminal, LTV monitoring, compliance reporting, and AI assistant. Pick the plan that matches your loan book.
| Feature | Starter $149 25 credits | Professional $549 100 credits | Business $2,499 500 credits | Enterprise $8,999 2,000 credits |
|---|---|---|---|---|
| Equipment + land + budget reports | ✓ | ✓ | ✓ | ✓ |
| Terminal portfolio monitoring | ✓ | ✓ | ✓ | ✓ |
| Continuous LTV tracking | ✓ | ✓ | ✓ | ✓ |
| FDIC/OCC compliance reports | ✓ | ✓ | ✓ | ✓ |
| PDF + CSV export | ✓ | ✓ | ✓ | ✓ |
| Market Intelligence + AI | ✓ | ✓ | ✓ | ✓ |
| Email alerts (LTV thresholds) | ✓ | ✓ | ✓ | ✓ |
| API access | — | ✓ | ✓ | ✓ |
| Batch CSV upload | — | ✓ | ✓ | ✓ |
| Priority support | — | ✓ | ✓ | ✓ |
| Dedicated account manager | — | — | ✓ | ✓ |
| Custom integrations | — | — | ✓ | ✓ |
Collateral Reports Your Examiners Will Love
Every asset. Every valuation. Timestamped, methodology-documented, and exam-ready.
Equipment Valuation
Collateral Valuation Report
2022 John Deere 8R 370
Report ID
AGS-SAMPLE01
April 17, 2026
Sold Value (Auction)
$271,500
Range: $255,000 — $288,000
38 auction comps
List Value (Dealer)
$304,000
Range: $285,000 — $325,000
46 dealer listings
Loan-to-Value (vs Sold)
71.8%
$195,000 balance
Confidence
High
84 total comparables
Valuation Methodology: Market comparable approach using Level 2 observable inputs per FASB ASC 820. Sold Value derived from 38 completed auction transactions (RitchieBros, PurpleWave, BigIron). List Value derived from 46 current dealer listings across independent marketplaces. Both values reported separately for transparency.
Comparable Market Data
8 auction results + 14 market listings
| Score | Year | Model | Price | Type | Hours | Source |
|---|---|---|---|---|---|---|
94 | 2022 | 8R 370 | $291,000 | SOLD | 1,720 | RitchieBros |
91 | 2022 | 8R 370 | $284,500 | SOLD | 2,100 | Purple Wave |
87 | 2021 | 8R 370 | $275,000 | ASK | 1,950 | TractorHouse |
82 | 2023 | 8R 370 | $310,000 | ASK | 980 | Mascus |
Depreciation Analysis
The 2022 John Deere 8R 370 is in the early ownership phase with 1,850 hours. Row-crop tractors in this class typically depreciate 8-12% annually in years 2-5. Current market values remain strong due to limited new inventory and high demand in the 300+ HP segment.
-4.2%
12-month price trend
Regional Price Breakdown
Fair Value Basis
FASB ASC 820 Level 2 — Observable market inputs from multiple independent data sources
Valuation Standard
Market comparable approach per FDIC/OCC collateral valuation guidance and FCA requirements
Report Certification
Report AGS-SAMPLE01 generated April 2026. Automated valuation — not a certified appraisal.
Land Valuation
Land Valuation Report
Story County — 160 acres
Report ID
AGS-SAMPLE02
April 17, 2026
Value Per Acre
$10,250
Total Land Value
$1,640,000
CSR2 Rating
82
Good productivity
County
Story, IA
160 total acres
Valuation Methodology: County-level farmland valuation using USDA NASS survey data, soil productivity ratings (CSR2), and comparable land sales. Adjustments applied for tile drainage (+8%) and soil quality (+2%). Cash rent analysis provides income-based valuation cross-check via capitalization rate.
Cash Rent Analysis
Soil Productivity
Value Drivers
Investment Returns
Mortgage Scenarios
Based on $1,640,000 financed, 0% down
Fair Value Basis
FASB ASC 820 Level 2 — Observable market inputs from multiple independent data sources
Valuation Standard
Market comparable approach per FDIC/OCC collateral valuation guidance and FCA requirements
Report Certification
Report AGS-SAMPLE02 generated April 2026. Automated valuation — not a certified appraisal.
Schedule a Demo
See how AgShared can replace multiple valuation services and save your institution tens of thousands per year.